"Count what is countable. Measure what is measureable. What is not measureable, make measureable." -- Galileo

Sunday, August 30, 2009

Cygnus atratus and CMS

A friend sent me a copy of Taleb's book, The Black Swan, and I've been giving it a read. One might wonder where a discussion of extreme events fits with Plone and CMS in general and I hope to close that loop before I'm finished today.

Let's start with a concrete example: the Dec. 2004 Sumatran earthquake and tsunami. Without getting into a debate about whether large earthquakes are true black swan events, this certainly fit the bill for millions of affected people.

In Nov. just prior to that, Enfold Systems launched Oxfam America's newly designed Plone portal. From an item at AllBusiness.com,
"In the course of ten days during the Tsunami crisis, Oxfam had almost half of its typical yearly visits, and almost 1/3 of its yearly bandwidth -- the system performed beautifully," said Internet Manager Nicholas Rabinowitz.
Oxfam raised $14M and credited Plone with a large part of making it possible to handle the scale of the relief response. Clearly this is an example of an enormous negative black swan event for people in the Indian Ocean basin, but a positive black swan event for Plone. This is exactly what Taleb promulgates as a successful strategy for managing risk--maximize your exposure to positive black swans.

Let's take this concept a step farther back and look at the general CMS environment. In the first decade of the 21st Century, we've seen CMS go from twinkle in someone's eye to dozens of major systems. The diffusion of the CMS innovation has been marked by a rapid evolutionary radiation into hundreds of web niches.

Many CMS niches are characterized by what are called path dependencies and network externalities. A path dependency explains how one set of decisions is constrained by what previous decisions. Vendor lock-in is a classic case in point that results in positive feedback for a particular, although possibly suboptimal, solution.

An organization that has drunk the Microsoft coolaid may very likely go with SharePoint as their document management solution and try to foist that off as a web publishing solution as well. But the original choice to go with MS may be a black swan in that it was a very rare, high consequence event from a software perspective.

Network externalities are where outside events drive a decision. Often this means that someone makes a decison to implement a particular CMS because its considered easier to find PHP programmers. (Don't get me started on the ease of learning Python and the readability of Python code.) What was the black swan that led to PHP predominance in web apps? I would hazard that the success of Apache running largely on Unix with tools like AWK led straight to second generation software like Perl and PHP.

I'm now seeing items in the innovation literature that point to yet a third factor that drives acceptance: lack of information. This lack of information on the relative merits of systems leads decision-makers to base their choices on whatever data chance has delivered to them. I've heard this refered to as the "PC Magazine-Air Travel Model," where a manager's decision is based on whatever he or she read in PC Magazine while flying back from DC.

In conclusion, I can't say I believe everything that a catastrophist like Taleb writes. As an evolutionary biologist, I'm well aware of the impact of catastrophies on evolving systems (for example, asteroids and K-T extinctions). But I feel the overall grist in the mill of complex systems is the day-to-day micro-improvements, whether a small favorable mutation or a PLIP solved by a Plone developer. Black swans are out there and we want to be the lucky ones who seize the opportunities they bring, but that doesn't mean I'll stop working on the small, almost unnoticed improvements that drive system change.

Sunday, August 23, 2009

Meaningful Stats?

Dylan Jay recently asked on the Plone Evangelism msg board, "Are there any stats about Plone's success that are really meaningful?" My first thought was to reply over there. But since the question is truly existential from a statistician's point of view as well as being of general interest, I thought I'd post a reply out in the wider blogosphere.

Dylan had also queried in his post by wondering if there's a way of determining amalgamated Plone revenue? His reasoning went that as a community, are there numbers that can compare apples with apples when looking across open-source and commercial products?

The difficulty here is that any single measure we pick will be integrating across multiple dimensions: large customer companies vs small, community sites vs web publishing, dot com's vs dot org's, and so on. In this blog I've explored (and continue to explore) various surrogates for the health of Plone and related CMS's.

Whether its PageRank at Amazon, BuiltWith percentages, Google trends, security vulnerabilities, Plone.net sites, Technorati posts, CMS Matrix features, or other statistical tidbit, these all fall short. Which is why I've always advocated a requirements-based decision process for determining if Plone is right for a particular situation. But that doesn't stop me from questing for the Holy Grail of web statistics--a simple way to measure effectiveness.

I'm still of the opinion that an aggregated set of metrics will be useful in this regard. See for example, one of my earliest posts where I was trying to fill in the gaps in a table where widespread adoption of Plone was based on acceptance and visibility. One of the attributes of acceptance was the economic health of 3rd party companies, something we still don't have a solid handle on (sorry Dylan).

Meanwhile, there are new "sentiment analysis" tools coming out as per this morning's NY Times. Of the free services, things look pretty rough. For example, Twitrratr lists as a negative post this tweat from our very Plone-positive friends in Pennsylvania, "xml is the wrong language for confi..." This confuses a post's source (planet Plone) with the keyword "wrong" and misses the subject of the negative feelings, "XML." The algorithms still need work, but here in the interest of fairness is a rundown.


PostiveNeutralNegative
Twitrratr9.09%
87.66%
3.25%
Twendz30%
59%
11%
Tweetfeel0%
n/a
100%
Clearly Twitrratr is displaying more precision than their algorithm merits and Tweetfeel (with n = 2) is missing most of the traffic of interest. Twendz does give a few details on how they are dynamically processing up to the latest 70 tweets. I'll keep an eye on these and related products to see how the technology is maturing and how it can help the Plone community improve itself.

Finally, in closing today I thought I'd finish up not with more statistics, but with a couple anecdotal items recently seen on Twitter:
Collaboration via Sharepoint is like kissing a warthog in August.
and
Trying to create a good site with MS SharePoint... cumbersome... I rather prefer Plone! #microsoft #plone.
Anecdotal evidence by definition isn't statistically significant and can be easily dismissed by those who need numbers to back up their decisions, but it occurs to me that I should be cataloging these sorts of statements. In time, I suspect we'll have quite a corpus because Plone does good stuff.

Next week: The diffusion of innovation and why people often standardize on sub-optimal solutions. Black swans, path dependence, network externalities, and the lack of information on the relative merits of systems.

Saturday, August 15, 2009

World-wide Hourly Site Usage

This past Thursday I had an opportunity to attend the monthly NM Tech Council's meeting. The topic was "Inside Google Analytics." The speaker was Chris Kenworthy, the owner of MediaGroup1 LLC and founder of DreamInCode.net, a leading online community for programmers and web developers.

After his very informative talk, I asked him about a question that has been vexing me for some time: How to untangle visits to Plone.org throughout the day when we have a world-wide community of users? I had thought that perhaps there was a local time dimension hidden somewhere.

Turns out that the solution is different than I'd thought but elegant. The trick is to use geographical areas instead of timezones.

Here's the result. Asia-Oceania is orange, the Americas are green, and Europe-Africa is Yellow. This gives us a very rough cut at timezones.

If we'd wanted finer resolution, we'd have used narrower bands of countries, but for this example plus-0r-minus 5 hours or so works well without a lot of effort.

Here's the how-to.

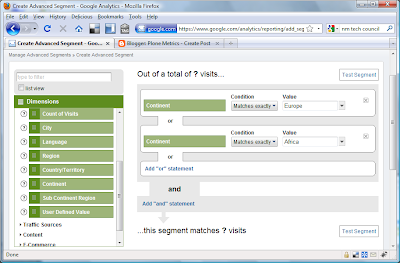
First, create advanced segments that match timezones.
  1. This is done under Settings | Advanced Segments (beta).
  2. Click on "Create new custom segment."
  3. At this point click on "Visitors" to expand the dimension list.
  4. Scroll down to the dimension of interest, in my case "Continent."
  5. Drag "Continent" onto the dotted box labeled "Dimension or Metric." Use regions or countries for higher resolution.
  6. Leave the condition as "Matches exactly."
  7. From the Value pull-down select, for example, "Europe." (True, this includes data from extreme eastern Russia, but we're keeping this simple.)
  8. Click on "Add 'or' statement."
  9. Repeat for a Value of "Africa" to include everyone in approximately UTC 0 to 4. Your segment should look something like the figure below.
  10. Save the segment under a meaningful name.
  11. Repeat for other geographical bands that represent the time slices you are interested in.
Now we can view our data.
  1. Back at the dashboard, select Visitors | Pageviews (or whatever y-axis value you like).
  2. Select the "Hour" icon.
  3. Set your date range.
  4. Using the (Beta) Advanced Segments pull-down in the upper right, check the boxes for your custom segments.
  5. Click "Apply" and, voila! you have our graph above. Remember that the hourly times given are Google Standard Time, aka San Francisco or UTC -8.
What can we learn from this?

In Europe and Africa, interestingly, we see dual peaks at 10:00 and at 13:00-15:00.

In North America, there's only a single peak around 11:00. Perhaps if I graph North American usage by states, I'll see a lunchtime dip, but our fastfood lunch hours may be showing up.

In Asia and Oceania I may have lumped things together too coarsely. Here there's a broad maximum from about 18:00 until 2:00 in the morning, which corresponds very roughly to mid-day when adjusted for UTC offset. I should go back and create two or three more segments. One would be an east Asia segment for Japan, Korea, China, Australia, and New Zealand. A second would be Indian, Pakistan, and other central Asian countries. A third might be southeast Asia.

So there you have it, hourly data from Analytics for a world-wide audiance. Enjoy!

Sunday, August 9, 2009

SharePoint Article in the New York Times

This morning's New York Times has an important article for all CMS developers -- a discussion of what and where MS SharePoint is. Of particular note is SP's success while MS sales overall have fallen for the first time in history.
“SharePoint is saving Microsoft’s Office business even as it paves the way for a new era of Microsoft lock-in,” said Matt Asay, an executive at Alfresco, which makes an open-source content management system. “It is simultaneously the most interesting and dangerous Microsoft technology, and has largely caught its competitors napping.”
Apparently, MS will be releasing a new version next year and Ballmer is quoted as saying SharePoint could be the next MS operating system.
Microsoft has managed to undercut even the panoply of open-source companies playing in the business software market by giving away a free basic license to SharePoint if they already have Windows Server. “It’s a brilliant strategy that mimics open source in its viral, free distribution, but transcends open source in its ability to lock customers into a complete, not-free-at-all Microsoft stack - one for which they’ll pay more and more the deeper they get into SharePoint,” Mr. Asay said.
The article mentions a Norwegian start-up, Fast Search and Transfer, as the key to increased SharePoint search capability. Those crafty Norwegians are everywhere :-)

Monday, August 3, 2009

Packt Open Source CMS Candidates

Interestingly, the Packt OS CMS Nomination forms have pre-populated pull-down menus. For those who care about such minutiae, here are the pre-approved CMSs in the Overall CMS category and, following that, the Other CMS category. Packt has pre-approved 65 CMSs for the overall group and 15 for the others. To put that in perspective, CMS Matrix lists 1017 CMSs.

By "other" Packt means non-PHP, so right off the bat, as in previous years, we've got ecclesiastical differences. I should also note that their Hall of Fame Award this year is limited to the two previous overall winners, Drupal and Joomla, plus whoever is this year's winner.

Without further ado, here are the lucky few who got their tickets pre-punched by Packt. So many CMSs; so little time.


Overall CMS

Alfresco
BigAce
Bitweaver
CMS Made Simple
Concrete5
Covide
CushyCMS
dotCMS
DotNetNuke
e107
EasyHP CMS
Elielton
Enano CMS
eXo Platform ECM
Exponent CMS
Expression Engine
eZ Publish
FlatNuke
FuzzyLime
Hippo
ImpresCMS
InfoGlue
Jamroom
Lanius CMS
Liferay
Lifetype
Mambo
MiaCMS
MODx
Mojo Portal
Moodle
Movable Type
MySource Matrix
Nuxeo
Onokazu
OpenCms
php fusion
PHPboost
PHPWCMS
Pligg
Plone
PyLucid
Radiant
Redaxo
Serendipity
Silva
Silverstripe
SkyPortal
Snews
Social Web CMS
Spip
TikiWiki CMS/Groupware
TYPO3
TYPOlight
Umbraco CMS
Unclassified NewsBoard (UNB)
WebGUI
Website Baker
Wordpress
Xaraya
XOOPS
YACS
Zikula
Zite
ZMS


Other CMS

Alfresco
Apache Lenya
Cuyahoga
DotNetNuke
Hippo CMS
Liferay
Mojo Portal
Movable Type
OpenCms
Plone CMS
PyLucid
Silva CMS
SkyPortal
WebAPP
WebGUI

Sunday, August 2, 2009

Nominations Open Monday

Packt announced that nominations for their 2009 Open Source CMS Awards will open on Monday 3 August. Nominations continue through September 11 and final voting runs September 21 through October 30. The award winners will be announced November 9. The Packt OS CMS Awards are entering their fourth year and their process is still changing each year, but it seems to be stabilizing.

Get out their and mobilize your OS community. Plone has done well in the "Other CMS" category and has been a contender for best overall in past years. Placing well with the Packt Awards does give some nice publicity immediately on the tails of this year's World Plone Conference.

Saturday, August 1, 2009

Trends from Builtwith

I just found BuiltWith Trends, which has some interesting CMS data among other things. My understanding is that they sample a large (but unspecified) number of domains and determine the web technology used. Looks like they're only publishing data beginning late last November.

The graph here definitely puts the Google Trends stats in perspective. I've extracted the individual data for a couple CMS and compiled them into one chart. It turns out that Joomla and Plone each account for a tiny fraction (<0.02%), whereas Google Trends shows Joomla far outstripping Drupal. Speaking of Drupal, they just recently scrabbled above 1.0% after bottoming out at 0.70% last Christmas.

At the bottom of each technology page is a pie chart showing how the last survey slices the entire domain, in this case, CMS. Drupal's 1.35% is 38.5% of all CMSs surveyed. Joomla comes in with 5.13% and Plone has 1.71%. In terms of ranking, Drupal is on top, Joomla is fifth, and Plone ties for eighth.

BuiltWith conveniently lists top sites using a given technology, although I'm not sure how they determine this. Plone's top sites are the CIA, Discover Magazine, ACM, and Connexions. Typically BuiltWith lists a maximum of 20 top sites, so I'm not sure how they missed Oxfam America, NASA Science, and a couple thousand others.

Just to give you an idea of the other's top sites, Drupal's top 4 sites are BrightCove, Us Magazine, iVillage, and NW Source. Joomla's are The Hill, RCN, SpellingCity, and everythingiCafe.

Clicking on a listed site will take you to a summary page that displays all the technologies that BuiltWith was able to extract from the domain in question. Very interesting stuff.

Like all web stats, they are to be used cautiously, all the more so when an explicit methodology is not stated. None-the-less, I'll definitely be following BuiltWith to see how things track over time. There's considerable noise in the data and one can't yet tell a trend from seasonal noise or something associated with a new version rollout.

All that said, this may be as close to market share as we're likely to get in the near future. The numbers don't segment the marketplace, so we still don't know if Plone is killing Drupal or vice versa in the government, education, and not for profit areas. Quite frankly the big surprise for me was that the total usage percent for CMS is only 3.67% of all the sites sampled by BuiltWith. Looks like global domination is still a ways off.